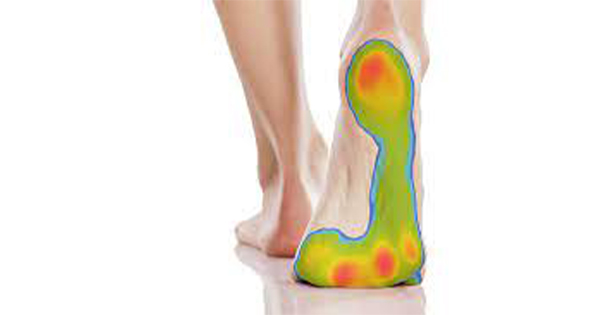
Force, pressure and three-dimensional movement analyses have become accepted contributors to the clinical assessment of the pathological foot (Boulton et al, 1987; Veves et al, 1991, 1992; Young et al 1992; Cavanagh and Ulbrecht, 1994; Lavery et al, 1996; Woodburn and Helliwell, 1996; Barnett et al, 2001; Otter et al, 2004; Newton et al, 2005). Over the past 20 years, many man-hours have been spent measuring and studying the force and pressure patterns produced during gait and standing. While this intense effort has yielded much interesting data, the role of such measurements in the management of the pathological foot is still both unclear and limited.
To date, attempts to use force, pressure and movement measurement as clinical or diagnostic tools have relied upon comparison of the data collected from people with diabetes (or other pathological subject groups, such as people with rheumatoid arthritis) with that collected from so-called ‘normal’ or control groups (i.e. those showing no pathology or without diabetes). The fundamental concept on which this approach is based is that for each variable there exists a ‘normal’ range of values, and that variable values that fall outside this range may be indicative of pathology.
This general concept has been widely accepted throughout the history of force, pressure and movement measurement of the foot.
In disciplines other than those related to health and social science, such as engineering, where inanimate objects with relatively predictable characteristics are the subject of investigation, such a concept may be regarded as an appropriate basis for research and analysis of the results produced. However, in the human foot the situation is more complex.
No two footsteps are the same
Individuals differ in a great number of anthropometric and physiological ways, all of which can potentially affect the parameters under investigation. Furthermore, the process of gait, while cyclic and predictable in gross terms, is anything but predictable in terms of the exact force and pressure distribution and movement patterns produced at each footstep (Akhlaghi et al, 1994).
Distribution patterns can, in this context, be spatial, temporal or a combination of both. With the further complicating factor of an ever-increasing number of measurable variables, the often stated has become self evident – that no two footsteps are the same.
Limits of normality
Acceptance of the concept that a normal range of variable values exists within a population raises two salient issues. The first is the possibility that such a normal range has defined limits beyond which a value can no longer be considered normal. If 123.5 kPa of pressure is normal, can 123.51 kPa really be considered abnormal? While such an arbitrary decision may never be made, the possibility that such a decision could be made has underpinned much research into force and pressure patterns produced during gait and standing.
There cannot, of course, be definitive cut-off points in variable values between normal and abnormal. The view more often taken is that movement of variable values away from the normal arithmetic mean represents an increasing probability that a pathology will or has occurred (Figure 1).
The second issue is that with all the research effort expended, little seems to have been achieved in terms of the use of force- and pressure-measuring equipment as diagnostic tools in clinical practice. The potential role of such tools in the prediction and prevention of some pathologies is undoubted; for example, their role in the management of foot ulceration in people with diabetes (Cavanagh et al, 1996) is testament to the potential importance of such systems in clinical management. However, in the author’s opinion they are still making a relatively limited contribution to patient care.
Limitations of the measuring systems
One possibility is that the lack of progress in this area has been the result of fundamental technical limitations of the measuring systems used (such as sensitivity, and temporal and spatial resolution). This view has resulted in the continuous development of equipment upgrades, producing ever more technically advanced equipment together with the inevitable spiralling of costs.
However, improvement in the equipment has not yet been mirrored by a similar improvement in subsequent clinical outcomes (Edmonds et al, 1996; Reiber, 1996; Booth et al, 1998). In the author’s opinion, an inevitable side-effect of this has been that measurement systems have increasingly become too expensive to be widely available to the clinician, and many systems can now only be afforded by the small number of elite research establishments. This has, therefore, limited the amount of patient data collected.
So, what is ‘normal’?
While efforts have concentrated on developing the equipment, the possibility exists that the underpinning philosophy is flawed. ‘Normal’ may not exist, at least not for the population. ‘Normal’ may not be a characteristic of the population, but of the individual. As each individual has an almost infinite number of identifying variables, any pressure or force patterns produced are the result of that specific individual’s combination of characteristics. The number of variables by which an individual can be described is enormous, so that the probability of that same set of variable values occurring elsewhere in the population is very small. While results collected from any one individual may lead to the identification of characteristics associated with him or her, their relevance to the rest of the population may be questionable.
The debate is further complicated when dealing with the foot. As each footstep is in some way different from those preceding and following it, the same constraints can be applied to footsteps as to individuals. Which footstep actually represents the individual?
There should at this point be a consideration of the term ‘normal’. The dictionary definition of normal is ‘conforming to standard’ (Soanes and Stevenson, 2003). Individuals vary within a population and do not conform to a standard value. A value that is normal for one individual may be indicative of pathology for another.
The anchor point for any clinical trial should therefore be termed the ‘usual’ (‘habitually or typically occurring or done; customary’: Soanes and Stevenson, 2003) variable value. This value should be based on data acquired from that individual rather than those produced by summarising data from a large number of other individuals, all of whom are, by definition, different. This may be a substantial argument for a rethinking of the purpose and process of screening. The best data against which to chart an individual’s pathology-driven change may be his or her own non-pathological data. While it is, unfortunately, rarely possible to collect data from individuals before their pathologies become apparent, the substitution of data from control or normal individuals may simply be inappropriate.
Concepts of normal
The concept of a normal value as a central point, movement away from which may be indicative of pathology (Figure 1), could be fundamentally flawed. This model assumes that normal, for any variable, represents a locus around which normal values are clustered: the further away from the locus the greater the chance of pathology.
An alternative theory is that normal values simply represent values that fall between a series of loci, each locus representing a specific pathology (Figure 2).
In this alternative model, the predicted spread of normal values within the population can be seen to be much greater than that anticipated by the accepted model. In this way the alternative model may go some way to explaining the apparent difficulty experienced by researchers in producing normal population values.
The complexity of the task is exacerbated by the possibility that each variable may exhibit a separate locus, and therefore different distributions will need to be constructed not only for each pathology but also for each variable by which that pathology can be assessed.
Conclusion
Based on this alternative model, research should focus on establishing force, pressure and movement values associated with the pathological foot. This may prove to be more productive than attempting to establish ‘normal’ values for the whole population, against which the values of people with pathologies can be compared. Characteristic force, pressure and movement values could then be combined with other known risk factors, such as neuropathy, callus and history of ulceration in the case of diabetes (Murray et al, 1996), to produce tools capable of playing a significant and widespread role in patient care.


