Abbreviations used
ACT: above critical threshold
A high glucose level above which 5% of readings fell.
AGF: average glucose fluctuation
Also known as glycaemic variation, this is a measure of how much a person’s blood glucose levels change throughout the day.
CV: coefficient of variation
A measure of how much a person’s blood glucose levels fluctuate. Expressed as a percentage, it indicates the risk of hypoglycaemia.
GMI: glycaemic management indicator
Approximates laboratory A1c level expected based on average glucose measured using at least 12 days of CGM values.
TIR: time in range
The amount of time that a person’s blood glucose levels remain within a specific target range.
Since the advent of insulin treatment in 1922, it has become clear that type 1 diabetes is accompanied by long-term microvascular and macrovascular complications, leading to associated morbidity and shortened life expectancy (Deckert et al, 1978). The Diabetes Control and Complications Trial (DCCT) demonstrated that blood glucose control was pivotal in preventing microvascular complications (DCCT Research Group, 1993). The study also demonstrated the value of HbA1c monitoring for risk prediction.
Capturing the time-averaged exposure to blood glucose through HbA1c measurement has become a cornerstone of diabetes diagnosis and management. However, HbA1c measurement may not be a good indicator of an individual’s glycaemic control, as it is underpinned by a wide range of mean glucose concentrations and glucose profiles (Beck et al, 2017). HbA1c does not, therefore, reflect some critical aspects of an individual’s glycaemic control. We find that HbA1c and clinical outcomes are not always linked, with certain individuals with higher HbA1c avoiding poorer outcomes and others, with lower levels, still incurring poorer outcomes. The advent of continuous glucose monitoring (CGM) has offered the opportunity to examine additional ways of relating glycaemic control to diabetes complication in people with diabetes.
In two recent papers, data from 89 people with type 1 diabetes over a period of up to 18 months was analysed (Heald et al, 2024a; 2024b). All were administering insulin in a basal–bolus regimen. The authors described a longer-term perspective on glucose variability, and the findings offer potential new insights into how we can make the most of CGM data.
CGM systems offer a number of metrics, such as overall glucose management indicator (GMI), percentage time in range (TIR) and coefficient of variation (CV). The relevance and effects of these, and their use in improving users’ understanding of their glucose control, is not, however, always fully exploited.
The authors calculated the average glucose value to derive a GMI for 15-minute time points through the day over the 18-month period. They also then considered average glucose fluctuation (AGF) for each point of the 24-hour day over 18 months, which was related to the absolute amount of change between readings. This identified those individuals whose average might be low, but who still had large glucose fluctuations during the day. It also enabled the percentage of glucose readings above critical threshold (ACT) to be calculated.
An ACT of 18 mmol/L was chosen, as 5% of overall glucose readings fell into this band. This was important, as clinical response to higher glucose may not be linear and the highest blood glucose levels might be reflected in poorer clinical outcomes.
The mean age of the participants was 42.6 (SD, 12.7) years, and the mean duration of diabetes was 18.4 (SD, 11.8) years. In the population studied, there were 45 women and 44 men. There was a total of 3.22 million glucose values, and mean blood glucose was 10.3 mmol/L. This reflected a mean GMI of 56.9 mmol/mol. Estimated GMI, based on 100 days of data, correlated closely with laboratory HbA1c for a parallel period, with an r2 of 0.82. The residual 0.18 of variance may be accounted for by physiological factors, such as differences in red blood cell glycation between individuals.
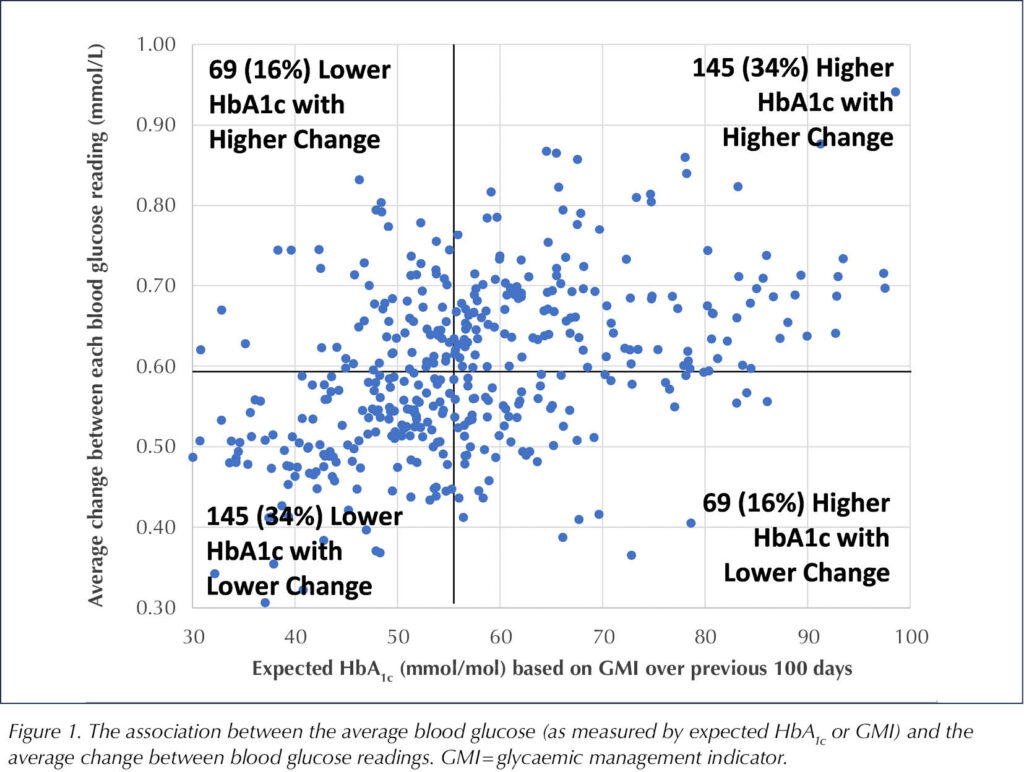
Figure 1 shows the association between the average blood glucose (as measured by GMI) and the average change between blood glucose readings. This was not consistent across participants. A significant number of individuals with higher expected HbA1c had lower change between blood glucose readings and may be at lower risk of complications compared to others who might have lower expected HbA1c and yet still have higher levels of change between readings.

Percentage of high glucose readings (ACT)
It was found that the percentage of blood glucose results above 18 mmol/L increased exponentially above a GMI of 54 mmol/mol. Thus, the relationship between the GMI and percentage of results above 18 mmol/L (i.e. the top 5% of the distribution) is not linear, with the percentage of high glucose readings increasing exponentially above 54 mmol/mol GMI. Importantly, even at a GMI as low as 60 mmol/mol, some participants had 10% of glucose readings above 18 mmol/L. That means that when clinicians look at GMI or HbA1c, even if these are apparently in target range, we need also to consider the proportion of glucose readings above 18 mmol/L, given that above this level the glucose toxicity at a tissue level becomes a major issue.
Variation by time of day
The investigators also looked at variation by time of day and reported that the percentage of glucose readings above 18 mmol/L was highest at 15:00, 18:00 and 22:00. When GMI for each time point through the day was analysed, it was found that GMI increased after midday, dipped at around 18:00 and rose again to 22:00, thereafter falling overnight. Interestingly, GMI averaged over the 18 months was nearly as low at midday as it was in the overnight period.
Average glucose fluctuation increased from 09:00 until the end of the day, being greatest at 19:00 to 20:00, and then declined overnight. It is known that greater daily glucose fluctuation, occurring between peaks and troughs, is linked to an increased occurrence of hypoglycaemic episodes (Kilpatrick et al, 2007).
Relation of derived glycaemic indices with tissue complications
The authors went on to look at how these indices related to measured clinical outcomes, included renal function (as measured by change in annual estimated glomerular filtration rate [eGFR]) and current retinopathy status (assessed by ophthalmology and determined as requiring treatment). The group was divided into three tertiles according to the status of these measurement indices, and the clinical outcomes observed in each tertile were compared to each other.
Those with the largest change in glucose from one reading to the next, summated over time, showed the greatest change in eGFR, an average reduction of 3.12 mL/min/1.73 m2 (P=0.007). Individuals with a higher proportion of glucose readings >18 mmol/L showed a greater fall in eGFR of 2.8 mL/min/1.73 m2 (P=0.009) and experienced higher rates of sight-threatening retinopathy (44% of these individuals; P=0.01), as did 39% of individuals in the highest tertile of average glucose levels (P=0.008).
Interpretation
There appears to be a linear relation between the degree of post-prandial hyperglycaemia with microvascular and macrovascular complications (Hanssen et al, 2020). Furthermore, greater HbA1c variability predicts retinopathy, early nephropathy and cardiac autonomic neuropathy, in addition to established risk factors, in type 1 diabetes (Virk et al, 2016). Thus, minimising long-term fluctuations in glycaemia may provide additional protection against the development of microvascular complications.
A key aspect of this work is that glucose data were summated over a long period of up to 18 months. An important finding is that the percentage of glucose results above 18 mmol/L (top 5% of the distribution) increased exponentially above 54 mmol/mol.
The paper suggests that over the 24-hour period, improvement in metabolic control could be focused on the afternoon and evening when levels of GMI, degree of glucose change and risks of being above the critical threshold of glucose levels are all higher than average.
The authors also suggested that a measure of glycaemic variation based on amplitude of glucose change to a population mean could be used to provide valuable clinical insights into glucose change over a 24-hour period. This may be a helpful addition to existing measures.
Take-home messages
Discussions with people with diabetes using CGM should reflect how reducing the percentage of glucose readings recorded above a critical level and also the degree of change in glucose measured over time can be key components in the strategy to reduce the likelihood of developing diabetes tissue complications.


Study provides new clues to why this condition is more aggressive in young children.
14 Nov 2025