
Longitudinal studies of children and young people with type 1 diabetes (CYPwD) with higher HbA1c levels have shown that these CYPwD have compromised or poorer motor skills, verbal skills and memory (Rewers et al, 2014). Further to this, there is evidence of neuropsychological dysfunction (Rewers et al, 2014). This is additional to other long-term vascular, neuropathic and psychological complications, including retinopathy, renal failure and poor perfusion (NICE, 2015).
This evidence informs us that tackling raised HbA1c in the CYPwD population is a priority. Ensuring the provision of appropriate education and support is paramount to ensuring a reduction in HbA1c level (NICE, 2015). Effective self-management requires frequent and high levels of educational input and continuing support to young CYPwD as well as with their parents and other caregivers (Lange et al, 2014).
Within the Birmingham Women’s and Children’s Hospital (BWC), the diabetes team supports CYPwD with elevated HbA1c levels to achieve optimum glycaemic control to ensure better long-term outcomes and reductions in complications associated with suboptimal long-term management (NICE, 2015; DiMeglio et al, 2018). There is “High HbA1c policy” in place based on the Best Practice Tariff (NHS, 2017) to provide frequent and ongoing support to those CYPwD who struggle to maintain an HbA1c level below 75 mmol/mol (9.0%). The policy up to 2016 mandated CYPwD who have a HbA1c of 75 mmol/mol or above at multidisciplinary team (MDT) clinic get a consultant review in six weeks, receive bi-weekly telephone calls and may access further psychosocial support if deemed necessary in MDT meetings.
In 2016, the High HbA1c policy was updated whereby CYPwD with psychosocial concerns who exceeded 75 mmol/mol were put on a keyworker database and provided with more frequent scheduled face-to-face contact by the same keyworkers. Seeing the same keyworker has been identified as important for CYPwD (Lawton et al, 2015). The purpose of this service evaluation was to assess the effectiveness of the keyworker database initiative.
Literature review
The Diabetes Control and Complications Trial (DCCT, 1993) was the largest multicentre, randomised controlled trial investigating 14441 adults with type 1 diabetes, including a small cohort of 195 adolescents. Participants were randomised to either intensive or conventional treatment and followed for 6.5 years. The DCCT provided clear evidence that improved glycaemic control achieved a significant risk reduction for microvascular complications, compared with conventional treatment. In the adolescent cohort, compared with conventional treatment, intensive treatment reduced the risk and progression of diabetic retinopathy by 53%, clinical neuropathy by 60% and microalbuminuria by 54%. The difference in HbA1c was 65 mmol/mol (8.1%) in the intensive group versus 83.6 mmol/mol (9.8%) in the usual care group (White et al, 2010).
The Epidemiology of Diabetes Interventions and Complications (EDIC) study continued to follow participants involved in the original DCCT. The EDIC Research Group (1999) demonstrated there was a halo effect that continued after the end of the trial. This strongly suggested that there was a memory effect of improved glycaemic usual care, now called a legacy effect (Lachin et al, 2000). After 30 years, the benefit of intensive therapy for reduction in macrovascular disease was corroborated, with a 50% reduction in cardiovascular events over a median of 17 years’ follow-up (DCCT/EDIC, 2016). The benefits of intensive therapy persisted in the adolescent cohort for 4 years during the EDIC study, with a 74% risk reduction for retinopathy, 48% less microalbuminuria, and 85% less albuminuria (White et al, 2010).
Although the landmark DCCT and EDIC results have been known for many years, there was little change in HbA1c nationally for CYPwD from 2004 to 2012 (RCPCH, 2018). This began to change in 2012–13 when a Best Practice Tariff became available to paediatric diabetes centres in England (Randell, 2012). The latest update to the tariff was set in 2017 (NHS England & NHS Improvement, 2017), where payment is dependent on services fulfilling a set of specific criteria to ensure consistent, high-quality management of diabetes regardless of the individual’s postcode. The Best Practice Tariff is a yearly £2972 per individual payment that covers all diabetes care until they have transitioned to adult services. The hope is to reduce unexplained regional variation in clinical results and to encourage best practice (NHS England & NHS Improvement, 2017). This is also reflected in the NICE (2015) guidance that advises HbA1c levels should be at around 48 mmol/mol (6.5%) for optimal long-term health outcomes.
One of the criteria is for each unit to have an operational policy, which must include a structured “high HbA1c policy”. The aim of such a policy is to provide extra support for CYPwD whose diabetes control puts them at very high risk of diabetes-related complications in the future. A “high HbA1c” was first defined by NICE (2004) at 75 mmol/mol (9.0%) or above and was reduced to 69 mmol/mol (8.5%; NICE, 2015).
There is no available literature to review on the “high HbA1c” policies of different centres in England and Wales. This is the first published service evaluation of such a policy mandated by the Best Practice Tariff. There is, however, one study published about the glycaemic variability in paediatric diabetes centres across England and Wales (Charalampopoulos et al, 2017), and the results focused on the variability in the clinic structures, rather than the high HbA1c policy.
Aim
The purpose of this service evaluation was to see if more frequent contact through the keyworker database improved outcomes in CYPwD with HbA1c ≥75 mmol/mol (9.0%). The findings could provide the foundations for the high HbA1c policy within BWC and establish whether keyworker intervention is required for all CYPwD with an HbA1c ≥75 mmol/mol.
The aims of the retrospective service evaluation were to:
- Assess whether more frequent face-to-face contact via keyworker database improves HbA1c outcomes in children with an HbA1c ≥75 mmol/mol with psychosocial issues.
- Gain insight into which contact measures are the most effective in supporting the improvement in HbA1c for CYPwD with an HbA1c ≥75 mmol/mol.
- Inform development of a new “high HbA1c policy” at BWC.
Method
Design and participants
This retrospective service evaluation looked at all the CYPwD in the BWC type 1 diabetes cohort records to assess if they had one or more HbA1c readings ≥75 mmol/mol from 1st Januray 2016 to 31st December 2016. CYPwD diagnosed in 2016 were excluded from the evaluation.
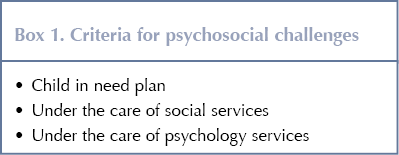
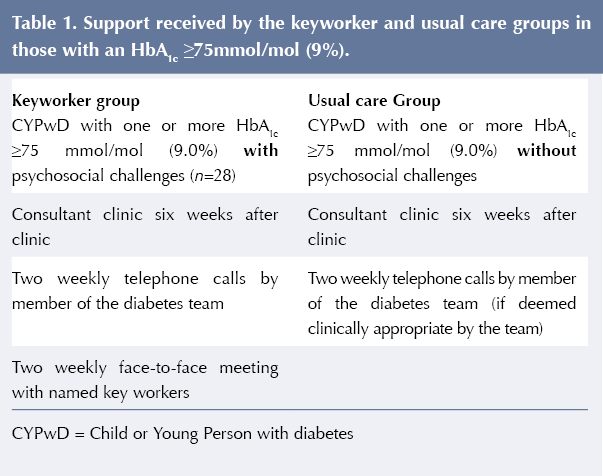
Of the 282 CYPwD in the BWC cohort in 2016, 93 had at least one HbA1c measurement ≥75 mmol/mol. The cohort of 93 CYPwD were split into two groups depending on if they were put onto the “keyworker database” in 2016 due to having psychosocial challenges (see Box 1). There was a total of 28 CYPwD in this “keyworker group”. The 65 CYPwD receiving usual “High HbA1c Policy” care are referred to as the “usual care group”. Table 1 details the intervention received by the keyworker and usual care groups. Each CYPwD in the “keyworker group” was assigned two keyworkers based on level of familiarity and geographic location. For each participant, there was a lead keyworker (keyworker 1) and a second keyworker (keyworker 2). If the lead keyworker was not present, the second keyworker could offer support.
Data collection
The following information was collected during the reporting period of 1st January 2016 to 31st December 2016 from the online diabetes management database (Twinkle.net; Hicom):
- Age.
- Duration of diabetes.
- Gender.
- Postcode (to determine socioeconomic deprivation).
- HbA1c (mmol/mol).
- Contacts received (face-to-face, telephone, MDT discussion).
Each of the 93 CYPwD Twinkle.net records were assessed to see if the individual had a child in need plan or social service plan, or wa under the care of psychology services.
Data analysis
The data were analysed via linear regression, considering how the HbA1c levels were affected by the keyworker intervention. Secondary analysis was carried out to explore the effect of each form of contact (face-to-face, remote, and MDT discussions) on HbA1c levels, while correcting for gender, socioeconomic status and time since diagnosis. The distance travelled in HbA1c levels were defined at two time points: 9 and 12 months.
Where model comparisons were made, the model HbA1c was used to judge model quality, with an optimal model being the minimum HbA1c score. Where step-function analysis has been used, multiple competing models were fitted over the independent parameter range, with the minimum HbA1c value indicative of the optimal model (Burt, 1964). All analysis was carried out in R using the stats package (R Core Team, 2019). Model fits were checked for linear-modelling assumptions via QQ-normal plots and Cooks distance – excluding data points with large values of Cook’s distance (Cook, 1977) or leverage (Harris et al, 2014).
Ethics
This service evaluation was a collaboration between Birmingham City University (BCU) and BWC. Ethical approval for this project was granted by BCU, in partnership with BWC. In all written reports, publications and papers, no CYPwD or their families were identifiable and there was no mention to any specific cases or information. All data were anonymised.
Results
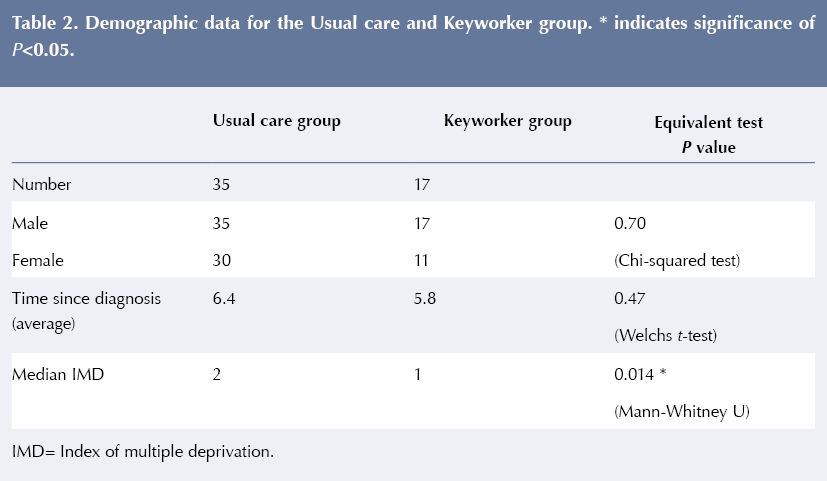
Differences between groups in gender, time since diagnosis and index of multiple deprivation (IMD) were compared for possible bias (Harris et al, 2014; Table 2). Both gender and time since diagnosis appear equivalent between the keyworker group and the usual care group; however, IMD rating appears to vary. A brief inspection of the IMD data revealed that the keyworker group had a lower representation of the higher IMD classes, with around 85% of the data drawn from classes 1 and 2 in the usual care group, compared with only 55% in the keyworker group. The lower classifications identified with the regions of most deprivation; hence this study’s findings may be of most use when considering the impact of the intervention in more deprived areas.
Initially, the change in HbA1c levels between 9 and 12 months was analysed via linear regression, taking enrolment in the keyworker database as the sole independent variable. At both time points, the intervention was found to have no effect on the level of HbA1c, with unadjusted changes in HbA1c of 1±4 mmol/mol; P=0.844) and –6±6 mmol/mol; P=0.324), respectively, for subjects assigned to the keyworker group. The 9-month follow-up dataset was found to have the most complete cases (75% compared with only 38% for 12 months’ follow-up), and hence all secondary analysis was performed using purely the 9-month follow-up data. The lack of data at 12 months is due to not all the CYPwD receiving four HbA1c tests from 1st January 2016 to 31st December 2016. There were a variety of reasons for this, including missed or cancelled clinic appointments and clinic cancellations.
With the data pooled (ignoring the use of the keyworker database) the 9-month HbA1c change was analysed as a function of the quantity of interventions (face-to-face, remote contact and MDT discussions) received over the 12 months of the study. Only face-to-face contact had a significant effect (–0.7±0.2 mmol/mol HbA1c per contact; P=0.002), with no significant change from remote contacts (0.12±0.07 mmol/mol; P=0.08) or MDT discussions (1.1±0.8 mmol/mol per contact; P=0.14).
The average case received 14.3 face-to-face contacts, suggesting an HbA1c reduction of 10 mmol/mol from face-to-face interventions for the average case. A change in HbA1c of this magnitude is of notable clinical significance, though the use of a linear model may over-emphasise the scale of the effect (Casson et al, 2014). Instead of being a continuous factor, there may instead be a “tipping point” – some level of face-to-face contact required to achieve improved glycaemic control – past which no further improvement is seen.
Analysis of reductions in HbA1c at 9 months and the level of face-to-face contact using a step-function model found 10 face-to-face contacts to be optimal. When the CYPwD received more than 10 interventions over the course of the year, there was a significant reduction in HbA1c of –12±3 mmol/mol (P=0.0005). These results are plotted in Figure 1.
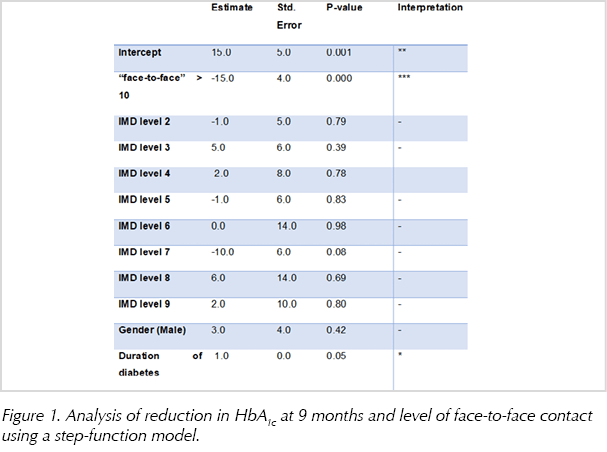
Repeating the step-function analysis and including three confounders (socioeconomic group, gender and time since diagnosis) also identified a “tipping point” of 10 face-to-face contacts. HbA1c decreased by 15±4 mmol/mol (P=0.00015) when the number of face-to-face contacts exceeded 10.
Logistic regression was carried out to investigate whether gender, time since diagnosis, frequency of remote contacts or frequency of MDT discussion increased the likelihood of the individual attending the necessary 10 face-to-face contact sessions to obtain a significant benefit. Only the rate of remote contacts had a significant impact (0.4±0.2 mmol/mol; P=0.02). This is equivalent to scaling the odds of 10 face-to-face contacts by 1.04 for each additional remote contact.
Discussion
The results of this service evaluation showed no difference in change in HbA1c over 9 months between the keyworker group and usual care group. This suggests the keyworker intervention did not have an impact. It must be considered, however, that the subjects in the keyworker group were deemed to have extra psychosocial challenges as identified by the MDT. It could be argued that, as the keyworker group achieved parity in HbA1c across the year, the keyworker database was a success; however, this is just speculation at this stage and, although it is beyond the scope of the current study, it could be the focus of future research. Achieving HbA1c parity across the year runs contrary to the rise that would be expected without extra support.
The finding of a “tipping point” at 10 or more face-to-face contacts across the year was a significant outcome, however. The 12 mmol/mol difference in HbA1c across the year between groups, which increased to 15 mmol/mol after adjustment for major confounders, in favour of those receiving 10 or more face-to-face contacts is of great clinical significance when the DCCT/EDIC results are considered. The adolescent cohort of the DCCT/EDIC study showed an 18 mmol/mol difference in favour of intensive treatment over usual care over 7.4 years. The benefits to the intensive therapy group four years after the study finished were a 74% risk reduction for retinopathy, 48% lower risk of microalbuminuria and 85% less albuminuria.(White et al, 2010).
The adult data suggest that having an HbA1c that is 10 mmol/mol lower will reduce the risk of micro- and macrovascular complications by over 40% (DCCT/EDIC, 2016). This amplifies the need to ensure CYPwD with an HbA1c ≥75 mmol/mol (9.0%) receive at least 10 face-to-face contacts annually.
The “tipping point” finding was used to re-shape the BWC High HbA1c policy from 2018 onwards. The 2016 High HbA1c policy was based on two-weekly phone calls with one face-to-face visit between three-monthly clinics. This added up to only eight face-to-face contacts each year, which was deemed sub-optimal following this “tipping point” finding.
In 2018, a new “High HbA1c clinic” model was introduced. The two major changes were a lower HbA1c cut-off of 69 mmol/mol (8.5%) and increased face-to-face contact with a nurse or dietitian clinic at 2, 4 and possibly 6 weeks after the MDT clinic. This ensured the “tipping point” was achieved in those with high HbA1c. Preliminary data analysis shows this new model has been a success. The overall clinic HbA1c dropped from 68 mmol/mol (8.4%) in 2017 to 62 mmol/mol (7.8%) in 2018 (P<0.01). Also, the CYPwD who attended the nurse or dietitian clinics between MDT clinic visits lowered their HbA1c by 10 mmol/mol (P<0.01).
To assess whether the recommended change in High HbA1c policy has been successful, the team plan to carry out an audit after a year, specifically looking at:
- Percentage of high HbA1c cohort who received ten or more face-to-face contacts.
- The difference in HbA1c between those who received 10 or more face-to-face contacts versus those who did not.
- Exploratory analysis into the reasons why some individuals receive less than 10 face-to-face contacts.
- Can the face-to-face contacts be delivered by virtual clinics using downloads and multimedia technology?
- Qualitative analysis of individuals’ reasons why face-to-face is preferable to telephone contact.
Study limitations
The authors have identified a number of limitations of this retrospective study. An important limitation is that the team were unable to conduct a comprehesive cost analysis for face-to-face contacts with their patients. For example, it would be beneficial to understand the cost implications of virtual sessions, clinic sessions or home visits, and consider whether the method of contact benefits the individual patient.
Furthermore, the authors acknowledge that there was an inconsistency in HbA1c data. Due to cancelled appointments and individuals not attending clinic for their HbA1c test, the authors were unable to obtain a full year of HbA1c data, and so the data analysis was limited to just 9 months.
All participants were assessed for psychological need via their Twinkle record. This was defined as those patients in receipt of ongoing psychological support provided by either the resident Diabetes Psychologist, Child and Adolescent Mental Health Services or an alternative service.
Conclusion
This service evaluation identified that 10 or more face-to-face contacts is a clear “tipping point” for individuals with an HbA1c ≥75 mmol/mol (9.0%). CYPwD receiving 10 or more contacts per year can be expected to have a 12–15 mmol/mol lower HbA1c than those who do not. This “tipping point” finding should change clinical practice and be audited for its reproducibility.


NHSEI National Clinical Lead for Diabetes in Children and Young People, Fulya Mehta, outlines the areas of focus for improving paediatric diabetes care.
16 Nov 2022