The hypertriglyceridaemic waist (HW) phenotype is defined as the combination of high waist circumference and high fasting blood triglyceride concentrations (Lemieux et al, 2000), and has been associated with an increased risk of coronary artery disease in both men and women (Arsenault et al, 2010). This phenotype has been widely used for identification of individuals with features of the metabolic syndrome and, thus, as a marker of greater cardiometabolic risk (Blackburn et al, 2009; Arsenault et al, 2010; Luksiene et al, 2014).
Despite the increasing use of the HW phenotype as a cardiovascular risk marker, there are inconsistencies in the reference values of waist circumference and triglyceride levels used to define this phenotype (Blackburn et al, 2009). Additionally, in studies characterising the HW phenotype in older people, cut-off values derived from younger adults have typically been used, despite the changes in body composition and dimensions that are known to occur in the aging process, such as such as an increase in waist circumference (Olinto et al, 2006; Carlsson et al, 2014). Therefore, this study aimed to compare the prevalence of the HW phenotype according to different diagnostic criteria in community-dwelling older people, and to analyse the association between cardiometabolic risk factors and the different HW definitions.
Methods
This was an observational survey with a cross-sectional design involving community-dwelling older people. Details about the location and the study population, as well as data collection, were published previously (Reis Júnior et al, 2014). Briefly, a census was conducted to identify all older people residing in urban areas. All those aged ≥60 years (n=355) were contacted for interviews and to carry out examinations (blood tests, arterial pressure measurement, anthropometric measures and motor tests). Out of 355 older people, 316 participated in the study (89.0%). There were 17 refusals (4.8%) and 22 individuals (6.2%) could not be located in their residences after three visits at different times. Data used in this study were extracted from the original population survey database. All procedures were approved by the Research Ethics Committee of the State University of Southwest Bahia, Brazil (no. 064/2011).
Measurements
Classification of HW
Waist circumference was measured at the umbilicus level (Callaway, 1988), and fasting blood triglyceride concentrations were analyzed with the Accutrend® Plus system (Roche Diagnostics, Germany) from blood fingerstick samples, after 12 hours’ fasting.
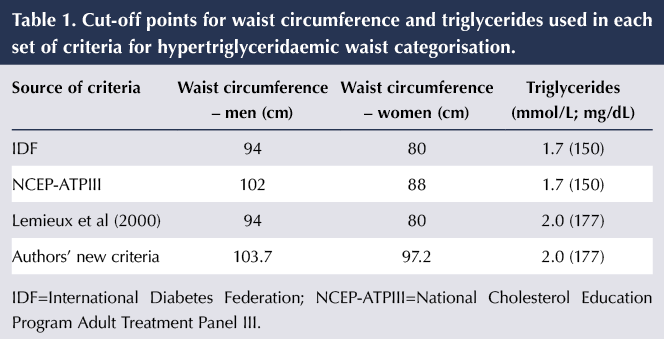
Four sets of cut-off points for waist circumference and triglyceride levels were used to diagnose HW:
- Values taken from the International Diabetes Federation (IDF) consensus statement on type 2 diabetes prevention (Alberti et al, 2007).
- Values taken from the NCEP-ATPIII definition of metabolic syndrome (National Cholesterol Education Program Adult Treatment Panel III, 2002).
- HW criteria proposed by Lemieux et al (2000).
- New HW criteria proposed by the current authors.
These cut-off points are listed in Table 1.
For the authors’ new criteria, given the lack of consensus about the cut-off points for waist circumference in older people, we used quartile values obtained from our study population, taking into account the methodological approach described by Felisbino-Mendes (2009). A waist circumference equal to or greater than the third quartile was chosen as the cut-off point. The triglyceride cut-off was the same as that proposed by Lemieux et al (2000), as blood triglyceride concentrations greater than this value are significantly associated with the atherogenic triad (increased serum levels of apolipoprotein B, hyperinsulinaemia and high levels of LDL-cholesterol).
Cardiometabolic risk factors
Blood glucose and cholesterol concentrations were obtained through fingerstick samples after 12 hours of fasting. The cut-off value for high-risk glycaemia was ≥7.0 mmol/L, and the use of antidiabetes therapy was considered when classifying subjects as having impaired glucose tolerance and/or diabetes (Oliveira and Vencio, 2015). For hypercholesterolaemia, the cut-off value used was ≥5.2 mmol/L (Xavier et al, 2013).
Blood pressure was measured using an automatic digital monitor (HEM-710 INT, Omron, China). Systolic blood pressure ≥140 mmHg and/or diastolic blood pressure ≥90 mmHg, as well as the use of antihypertensive drugs, were used to identify hypertension (Sociedade Brasileira de Cardiologia, 2010).
The International Physical Activity Questionnaire (IPAQ) was used to classify physical activity (Bertoldo Benedetti et al, 2007). Participants who had less than 150 minutes per week of moderate or vigorous physical activity were classified as insufficiently active (Hallal and Victora, 2004).
BMI was calculated from weight and height values. The population was stratified as overweight (>27 kg/m2) or not overweight (≤27 kg/m2; American Academy of Family Physicians, 2002).
Statistical analysis
The associations between HW, as determined by each of the four sets of criteria, and the risk factors for cardiometabolic disease were analysed, with the following risk factors for cardiometabolic disease taken as independent variables: elevated total cholesterol, elevated blood pressure, smoking, diabetes/impaired glucose tolerance, insufficient physical activity, excess weight (BMI), age and sex (Lemieux et al, 2000).
Absolute and relative frequencies from each variable were calculated for the cohort as a whole and for each sex. The statistical differences were evaluated using the Pearson chi-squared test.
To compare the prevalences of HW according to the different diagnostic criteria, the McNemar test was used. Agreement between the different diagnostic criteria was analysed with the kappa index, with the degree of agreement based on criteria established by Landis and Koch (1977).
Multiple logistic regression was used to test the associations between the independent variables and HW. For all the models generated from the regression analysis, a stepwise method was used to select the variables. From the logistic regression parameters, adjusted models were calculated to estimate the odds ratios (ORs) and 95% confidence intervals (CIs). The data were analysed with IBM SPSS Statistics for Windows.
Results
Of the 316 older adults who comprised the survey’s population, 299 (94.6%) matched the inclusion criteria to construct the dependent variables of this study. The mean age was 74.3 years.
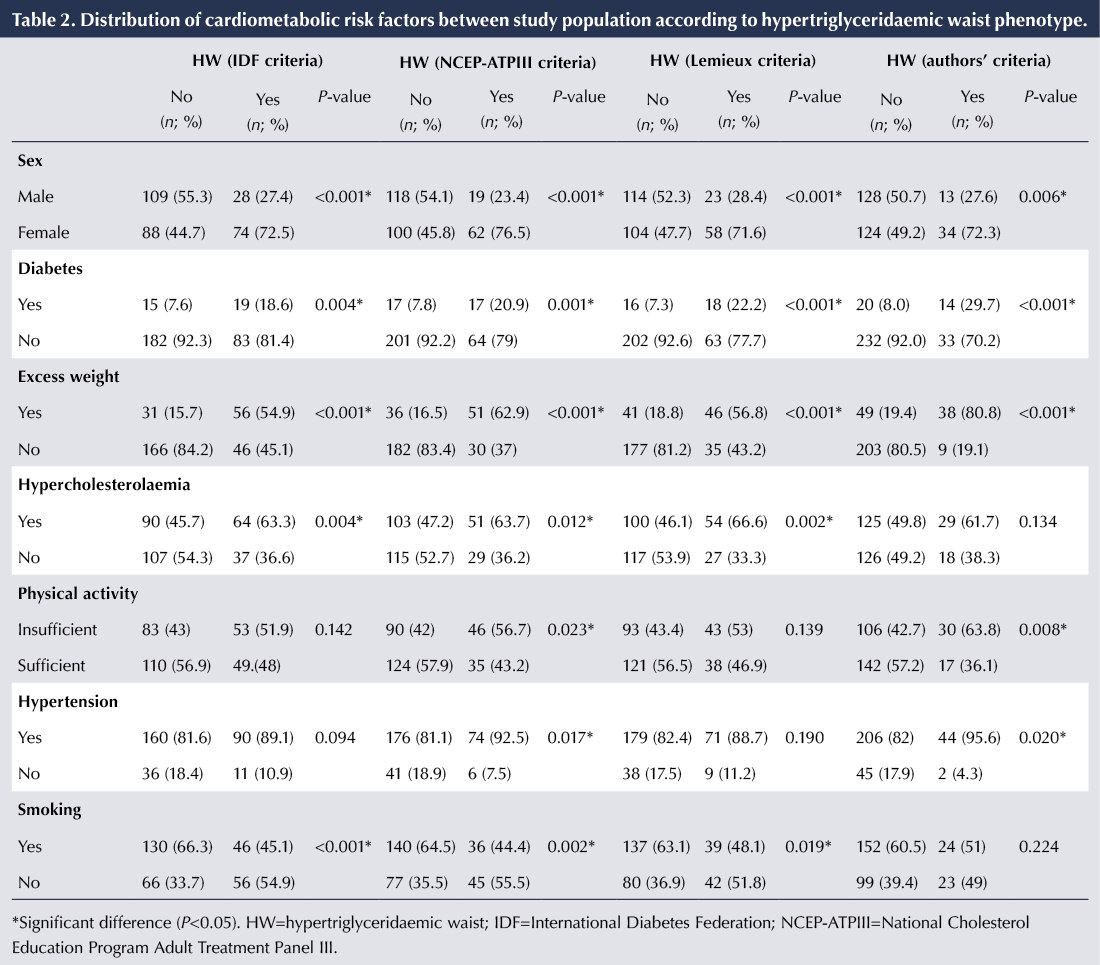
Table 2 compares the frequencies of cardiometabolic risk factors between the four HW criteria. Overall, the HW phenotype was more prevalent among women. Additionally, excess weight, insufficient physical activity, diabetes and hypertension were more frequent among those with the HW phenotype.
The prevalence of HW according to the IDF, NCEP-ATPIII, Lemieux and colleagues, and authors’ criteria was 34.1%, 27.1%, 27.1% and 15.7%, respectively (Figure 1). According to the McNemar test, there were significant differences (P<0.01) between these prevalences.
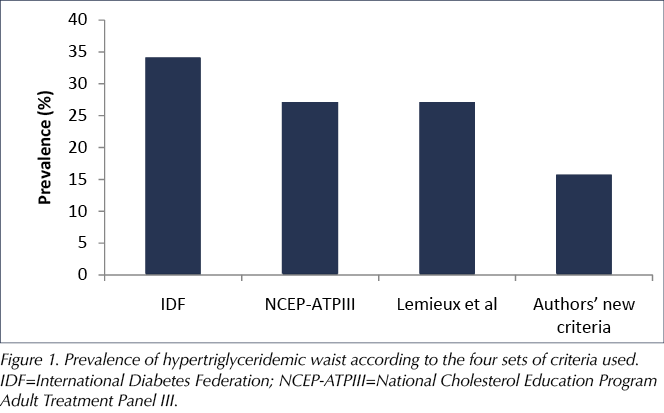
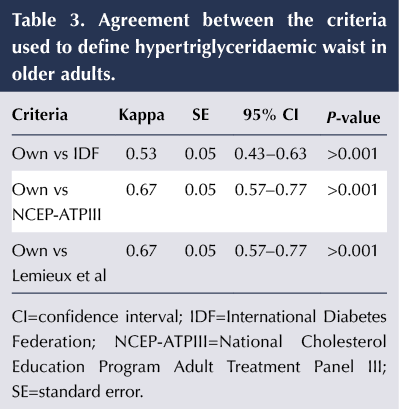
Table 3 compares the kappa scores between our own criteria and the other sets of criteria to define HW in the present cohort. The level of agreement was moderate.
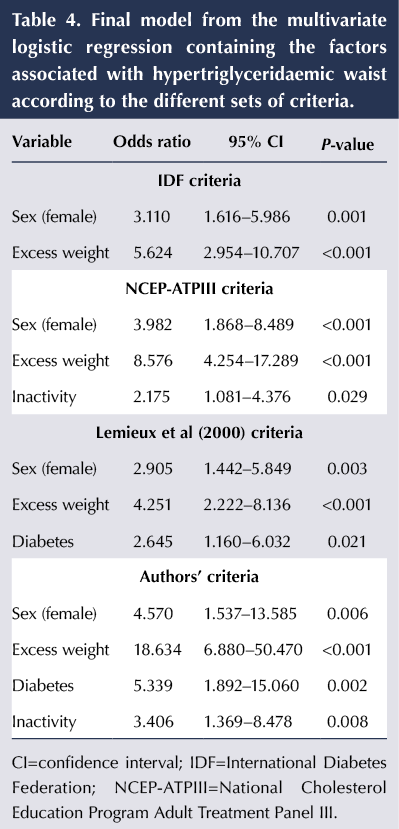
Table 4 presents the associations between the cardiometabolic risk factors and HW from the final model obtained in the multivariate logistic regression. The variables sex and overweight remained associated with all four sets of criteria to define HW.
In addition to sex and overweight, in the model obtained from our own criteria, diabetes (OR, 5.339) and an insufficiently active lifestyle (OR, 3.406) were associated with the HW phenotype. With the criteria proposed by Lemieux et al (2000), diabetes was the only other associated factor (OR, 2.645), and with the NCEP-ATPIII criteria, insufficiently active lifestyle was the only additional factor (OR, 2.175).
Discussion
This study analysed the prevalence of the HW phenotype according to four different classification criteria in older people. Agreement among the criteria and the associations with cardiometabolic risk factors were also analysed, which makes this study unique. The results revealed that, depending on the criteria used, the same individual could be classified with or without HW, which affects the generalisability of studies that use the HW phenotype in older populations. Additionally, different classification criteria led to different associations with cardiometabolic risk factors.
In a study by Blackburn et al (2009), the HW phenotype (defined as waist circumference ≥90 cm and fasting triglycerides ≥2.0 mmol/L), the NCEP-ATPIII criteria for metabolic syndrome and the IDF criteria for diabetes risk were used to identify middle-aged men at increased cardiometabolic risk. The authors concluded that HW was as discriminant as the NCEP-ATPIII and IDF criteria, and could be used as an initial screening approach to identify individuals with increased cardiometabolic risk. Since the HW phenotype classification is based on only two simple parameters, its use in the screening of cardiometabolic risk could be advantageous.
Despite this, the lack of consensus about the cut-off values of waist circumference and blood triglycerides may lead to different estimations of the prevalence of HW and its association with cardiometabolic risk factors. The use of general cut-off values for anthropometric features, obtained from heterogeneous samples, could be another factor that compromises studies in this field, especially when the study populations are restricted to older people.
Indeed, in the current study, the prevalence of HW was significantly different depending on the classification criteria used, being highest with the IDF criteria (34.1%) and lowest with the authors’ proposed criteria (15.7%).
Previous studies into the prevalence of the HW phenotype and its association with cardiac risk have included older people in the study populations; however, they have not distinguished cut-off values between younger and older adults (Arsenault et al, 2010; Blackburn et al, 2012; Querales et al, 2014). It is difficult to compare the prevalence obtained in the current study with those obtained in the literature, as studies in this field including only older people are scarce. Carlsson et al (2014) studied a group of men aged 70 years and found a prevalence of 18.1% for the HW phenotype, using the criteria of Lemieux et al (2000). In our study, considering only the men, the prevalence of HW according to the Lemieux criteria was 17%, very close to that in the former study. However, the prevalence of HW among men varied from 9% with our own criteria to 20% with the IDF criteria.
Heim et al (2011) proposed that the use of cut-off values recommended by international entities, such as the IDF and World Health Organization, for older people (>70 years) leads to health risks due to misclassification. The use of cut-off values obtained from studies involving the general population may lead to overestimation of the prevalence of HW in older people. Our results corroborate this hypothesis, since the use of different cut-off values led to significant differences in prevalence of the HW phenotype. Based on the model fit obtained by Heim et al, cut-off values for waist circumference between 100 cm and 106 cm were appropriate in men, while in women the optimal cut-off was 99 cm. Interestingly, our own cut-off values for waist circumference, obtained using the third quartile from our study population, were 103.7 cm for men and 97.2 for women, which were very close to those proposed by Heim et al.
The regression models in our study showed that sex and excess weight were associated with the HW phenotype according to all four definitions. In fact, BMI, the adopted indicator for excess weight, is associated with abdominal obesity indicators, such as waist circumference (Gomez-Huelgas et al, 2011), which explains the significant association observed between BMI and all four adoptaded criteria for HW. In this context, greater odds ratios were obtained in regression models where the cut-off values for waist circumference were highest (i.e. NCEP-ATPIII [102/88 cm] and our own criteria [103.7/97.2 cm]). The significant association between women and the HW phenotype in this older population could be explained by the accelerated shift toward central fat distribution that occurs after menopause, while men tend to exhibit a greater central fat distribution earlier during adulthood (Heim et al, 2011).
Carlsson et al (2014) have demonstrated the significant association between HW and diabetes in older people. Our results corroborate these findings, but this association was observed only when using our own criteria and those proposed by Lemieux et al (2000). Interestingly, these criteria have in common the cut-off value for triglycerides of 177 mg/dL (2.0 mmol/L); therefore, this finding could be explained by the relationship between dyslipidaemia, especially hypertriglyceridaemia, and insulin resistance, resulting in abnormal metabolic responses (Savage and Semple, 2010; Lee et al, 2014).
Carlsson et al (2014), in a longitudinal study involving older men, observed that the HW phenotype was associated with diabetes, the risk being four times higher than in those without HW. In our study, the odds ratios for diabetes were 2.645 and 5.339 when defining HW by the Lemieux criteria and our new criteria, respectively.
An insufficiently active lifestyle was associated with the HW phenotype according to the NCEP-ATPIII and our own criteria. Carlsson et al (2014) demonstrated that regular physical activity was inversely associated with the metabolic syndrome. Additionally, the higher cut-off values for waist circumference adopted by these sets of criteria may explain our results, since an active lifestyle has been associated with a lower waist circumference in both sexes (Ekelund et al, 2011).
Conclusions and summary
The results of this study allow us to conclude the following:
- The prevalence of the HW phenotype varies in old people depending on the criteria used.
- The agreement between the HW classification criteria was unacceptably low.
- The cardiometabolic risk factors associated with the HW phenotype vary depending on the criteria used in older people.
- Although they resulted in the lowest observed prevalence of HW (15.7%), the authors’ new criteria were associated with the greatest number of cardiometabolic risk factors when compared with the other criteria.
These findings indicate that the adoption of different criteria to obtain a diagnosis or classification of HW in older people may generate different data on the prevalence and risk factors associated with phenotype. This should influence decision-making in governments’ public health policies.


Developments that will impact your practice.
29 Aug 2025